MPEye is a visualization program for parallel programs which use the Message Passing Interface(MPI). In order to enable MPEye to visualize a parallel program, that program is linked to a modified version of the MPI library which records communication logs on each node. MPEye then reads and analyzes these logs, and visually displays the program's communication. Two views are available on the data. The message timings view graphically displays exactly what messages were sent between which processors at what times and how big they were. The network load graph displays the amount of traffic between every pair of nodes for any given time interval during the program's execution.
Parallel processing has some great advantages (speed, for example), but also suffers from some significant drawbacks. One of these is the difficulty of writing parallel programs. One of the main reasons parallel programs are hard to write is that it is often hard to tell exactly what the program is doing at any given time. This makes both debugging and performance tuning an extremely difficult tasks. To simplify these tasks, I have designed an implemented MPEye, a visualization tool for use with parallel programs that use the Message Passing Interface (MPI). MPI is one of the most popular architectures used in parallel programming, so MPEye can be a useful tool for a lot of programmers.
The first step in visualizing an MPI program is to gather its communication data. This requires some modifications to be made to the MPI library itself. For this project, the modifications were made to David Ashton's MPI library for Windows NT, so MPEye currently works only for programs that are run in this environment. The modifications to the library that record the logs are quite simple, however, and can easily be added to any version of the MPI library for which the source is available.
The first step when recording the logs is to synchronize timers on all machines so that the message timing records from the different machines can be compared. The root node sends a tiny message to all other machines during MPI_Init telling them to start their timers. This provides synchronization to within the latency between the root node and each of the other nodes. This slight inaccuracy can be corrected when analyzing the logs by adding a small fudge factor to the times to account for that latency. The timers used are Windows NT high-performance counters, which provide accuracy on the order of microseconds.
The operations for which data is recorded in the logs are send, receive, broadcast, allreduce, reduce, scatter, gather, and barrier. For each of these operations, the following data is recorded in the log: start and finish time, data type, communicator ID, source, destination, tag, and size.
In order to speed up execution during visualization, some processing is done on the logs right after they are loaded. The logs are all combined into one big log in memory, and the receiving and sending ends of each message are matched up and combined into one record for that message.
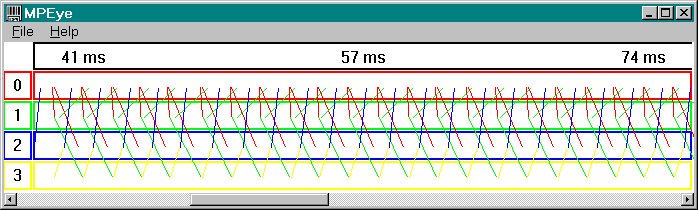
The message timings graph allows the user to see each message that was sent and its timing relative to other messages. This makes it easy to isolate bugs and performance issues related to the timing an number of messages. For example, if it would be more efficient to send fewer messages with more data, it will be apparent from this graph. The view is split up into nproc horizontal bars, each representing one of the processors and outlined with a unique color. Across the top is a bar showing the time scale and the elapsed time from when the program started. For each message, a line is drawn ranging vertically between the middle of the sender's bar and the middle of the receiver's bar and horizontally between the time the message was sent and the time it was received. The line is colored the color of the sender's bar, and its width depends on the size of the message. The amount of data corresponding to each pixel of line width is, of course, adjustable.
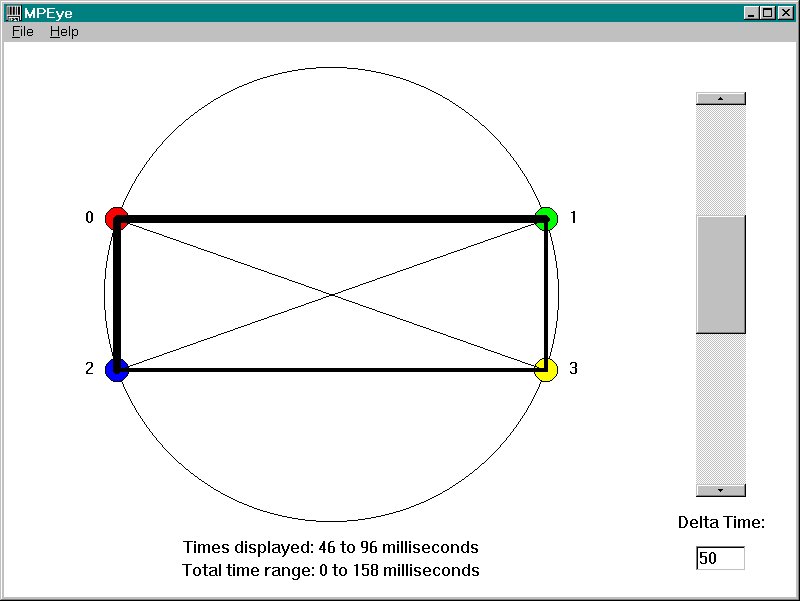
The network load graph allows the user to see the amount of network traffic being sent between all nodes during any given time frame. This view makes it easier to isolate bugs and performance issues related to the amount of data being passed and the distribution of communication between different nodes. The network load graph consists of colored points distributed around the perimeter of a circle with lines connecting the points. Each point represents one processor and is colored the color of that processor and numbered with that processor's iproc. The line between each pair of points represent the traffic being transferred between those points. The width of the line represents the amount of traffic. As with the message timing graph, the amount of data corresponding to each pixel of line width is adjustable.
Below this circle the time interval currently displayed by the graph is shown, along with the total execution time of the program. To the right of the circle is a scrollbar that selects which time interval to display, and an edit box to select the size of the time intervals.
In an effort to improve the ease and efficiency with which parallel programs can be written, I have designed and implemented MPEye, a visualization tool for parallel programs written with MPI. This tool will make parallel programs easier to write by making debugging, profiling, and performance tuning easier tasks. It allows the visualization of message timings, amount of data transferred, and number of messages sent. MPEye makes parallel programming a more pleasant process.